Priority Analysis of PBL Evaluation Score using AHP
Article information
Abstract
Purpose
The aim of this study was to improve the objectivity of an assessment scale by applying the Analytic Hierarchy Process (AHP) methodology with the learners themselves determining the weightings against the importance of evaluation factors.
Methods
By analyzing assessment results of 20 respondents, calculations of the relative importance of the PBL evaluation factors were made.
Results
The PBL rating scale factor (0.450) was the most important factor in the first criterion. As a result, participants in the PBL class were weighted more heavily on the evaluation of the members of the team. Within the evaluation of team members using the second criterion, they were interested in problem solving activities (0.287) and self-direction (0.283) - these were highly weighted. Finally, in the relative importance (global weight) of all the measures (12) in the secondary criterion, problem solving activity (0.129) was found to be the most important activity in applying PBL processes.
Conclusions:
As a result, it is possible to increase the satisfaction of the learning effect by setting the weight of the PBL evaluation scale. Hence, this educational design based on creativity has the advantages of PBL in that the students become more involved in class by engaging themselves creatively and actively, and the university can naturally contribute to nurturing creative talents.
INTRODUCTION
In the era of the 4th Industrial Revolution, it is socially demanded to cultivate creative talents based on information based society and knowledge based society. In order to cultivate these talents, education based on creativity is being expanded (Kautsar & Sarno, 2019). There is an advantage to developing small groups with problem-based learning (PBL) problems to develop teamwork, leadership, communication and communication skills, creative thinking and critical thinking, especially through group activities (Lozano et al., 2015;Sipes, 2017;Woods, 1996). In other words, this approach allows students to experience the creative process of PBL problems through voluntary learning activities and experience the process of actively solving existing knowledge and new knowledge (Kolmos, De Graaff, & Du, 2009).
Specifically, classes through PBL are naturally evaluated in the course of identifying students' activities and confirming whether they acquire the necessary knowledge in the PBL problem solving process, unlike the middle and final exams commonly used in general lectures (Jang et al., 2013). The evaluation of individual activities during the learning assessment should be performed, as well as group assessments of small group activities. It includes a variety of evaluation methods such as oral presentation evaluation, detailed evaluation, report evaluation, team portfolio evaluation, exhibition evaluation, team peer evaluation, and attendance for the PBL team performance evaluation of the PBL team. This PBL leads to more subjective judgments than to test evaluation in general lectures although all performance evaluation are subjective (Prihatiningsih & Qomariyah, 2016). Therefore, there is a dissatisfactory aspect of the students' evaluation. Therefore, for a more objective assessment in PBL classes, it is necessary to clarify the evaluation method at the beginning of the class and to make the evaluation ratio among the evaluation factors by the students themselves. Finally, this study intends to analyze the results of introducing a method of calculating the relative importance of these factors.
METHODOLOGY: PBL USING AHP
PBL method can be used for real-world problems seen in real life and motivation and interest can be gained by learning related problems. In the end, the greatest advantage of the PBL method is that it is not a lecture by a professor, but a learner-centered learning in which students have to solve problems themselves (Barrows, 1985).
In general, when grading the PBL, the relative importance of each assessment factor for class participants is calculated equally. However, as more detailed and specific evaluation, students will be able to improve their class satisfaction by giving them the relative importance of the evaluation factors in advance. Therefore, this study will be based on volunteer surveys of students in order to calculate the importance of evaluation factors. These surveys were conducted by ZU et al. (2011) will apply the AHP (Analytic Hierarchy Process) research method used in the PBL evaluation.
AHP used in this study is one of the decision support methods based on multivariate evaluation criteria for multiple alternatives. It was first proposed in the paper "The Analytic Hierarchy Process" published by Thomas Saaty in 1980. In particular, AHP has been widely used in the field of decision making due to the simplicity and clarity of theory, simplicity of application and versatility, and research on theory has been actively conducted. These AHPs can classify the problems by layering and segmenting the problems themselves, and it is possible to classify the problems in a hierarchical manner, to eliminate the error information through the consistency test of the pair comparison, and to ensure the reliability of priorities due to the objectivity and reliability of the importance of the elements. In particular, logical consistency can be verified if there are three or more comparisons against a specific criterion. If the inconsistency ratio is higher than 0.1, the decision of the respondent (decision maker) is considered to be lacking in logical consistency (Saaty, 1980).
In this study, this study apply the following procedure.
Typically, decisions made through AHP are generally subject to the following six steps (Saaty, 1980).
The first step is to define the problem and derive the decision factors. At this stage, this study clarify the problem (purpose) through brainstorming, literature survey, expert opinion gathering, and derive judgment criteria and alternatives. It also sets the "musts" criterion as a criterion that must be met and removes alternatives that do not meet the "musts" criterion. For example, eliminate alternatives that cost more than a given budget. In this study, each evaluation factor will be investigated and listed based on existing studies. For example, Kang In-ae (2003) presented four major evaluation papers: PBL self-evaluation, peer evaluation in PBL team members, PBL team evaluation, PBL team evaluation.
The second step is the decision-making model. It builds a decision model in the form of a hierarchy that includes all of the decision-making elements such as analytical objectives, criteria, sub-criteria, and alternatives. Other factors (actors, scenarios, etc.) may be included. At this time, it is recommended that the number of objects to be compared with respect to the same criterion is not more than nine. For example, the number of the highest judgment criteria to be compared with respect to the objective is not more than 9, or the number of the lower judgment criteria to be compared with the specific highest judgment criterion is not more than 9. This research will model the relationship between the factors by classifying the evaluation factors determined in the first step. In the example of the previous step 1, the personal evaluation and the team evaluation can be classified and modeled.
The third step is the evaluation of factors through pair comparisons. This means that each decision element is assessed through a one-to-one pair comparison of how important or preferential to the parent element is (ie, a higher decision criterion for the objective, a lower decision criterion for the higher decision criterion, To evaluate the alternatives). Use as many factual data as possible and assess qualitative parts of the problem using knowledge, experience, and intuition. In this study, the AHP questionnaire will be used to make a relative assessment among the factors.
The fourth step is the verification of logical consistency. The next step in analytical thinking is to judge how logical decision consistency of decision makers (or survey respondents) is. Improves logical consistency by identifying inconsistency ratios for evaluation results for elements through pair comparisons. As a result of the experiment and the verification, if the inconsistency ratio exceeds 0.1, it is judged that the inconsistency of judgment exceeds the acceptable level. Therefore, if the inconsistency ratio is higher than 0.1, it is necessary to review the result of the pair comparison again and to modify the judgment of the illogical part. This study discusses the results of survey responses and improve the reliability of the analysis results by maintaining consistency.
The fifth step is the integration and group judgment. It integrates the evaluation results of the elements through pair comparison to derive the importance between the judging criteria and to derive the optimal alternative or to derive the priority and importance between the alternatives. For this purpose, the final priorities (importance or priority) of the elements are derived from the eigenvalues of mathematics from all pairwise comparison matrices. In the case of a large number of decision makers, the opinions of all decision makers are integrated. At this time, the consensus of multiple decision makers utilizes the geometric mean value. In some cases, only the importance of the criteria is determined without any alternative.
In this study, this study will present the result of applying the students' consensus to the class with the importance score of each evaluated factor.
ANALYSIS RESULTS
1. Research scope and data collection
The temporal range of this study will be based on the research procedure starting from the base year (2019). The spatial range of this study is the PBL class operated by the researcher, and the overseas case is set as the spatial range to grasp the international flow in order to investigate and collect the related literature review in advance. The importance of the evaluation factors in this study will be based on the voluntary questionnaire of the learners, so students will be satisfied with the assessment items and more objectivity. This analysis will lead students to a consensus and apply them in practice before class. In other words, it can be used to derive the results of this analysis and apply it to the actual PBL class, and to improve the aspect of the class evaluation through feedback.
While explaining the research ethical aspects in advance, the data used in this study consisted of a total of 20 copies focused on the postgraduate reseachers, lecturers and interested respondents in the PBL-related class (2019), and the final data were analyzed.
The items in the questionnaire presented in this study were applied excerpts from the study of Kang (2003) (see Table 1). The first criterion presented in table 1 was classified into three categories: self-evaluation, team-member evaluation, and team evaluation. Four criteria were set as secondary criteria.
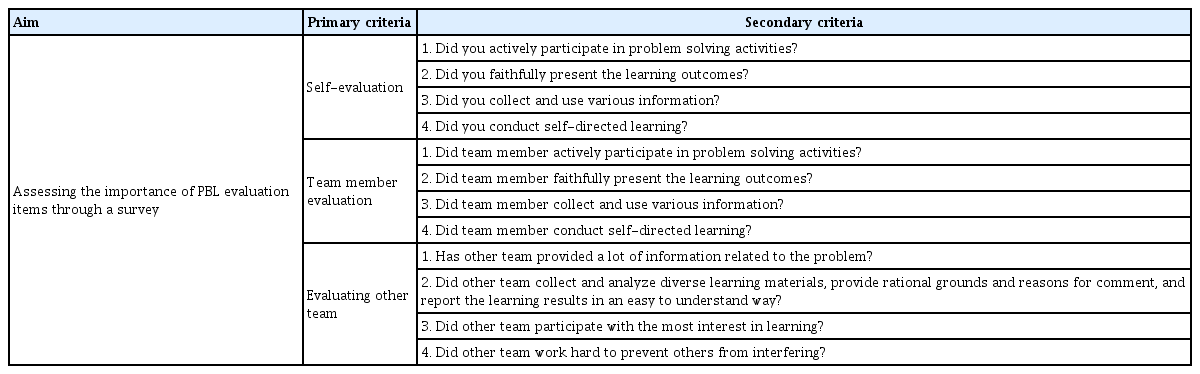
Questionnaire evaluation items
2. Empirical results
The inconsistent data of the collected responses were corrected by Expert Choice (AHP software) and final analysis was conducted. The inconsistency here refers to the level of reliability of the response result. The consistency of the results obtained through the AHP analysis is confirmed by the consistency ratio (C.R.). The consistency ratio derived from this study is considered to be lacking logical consistency when it is higher than 0.1.
Table 2 shows the relative importance results of each of the measured primary and secondary evaluation scales.
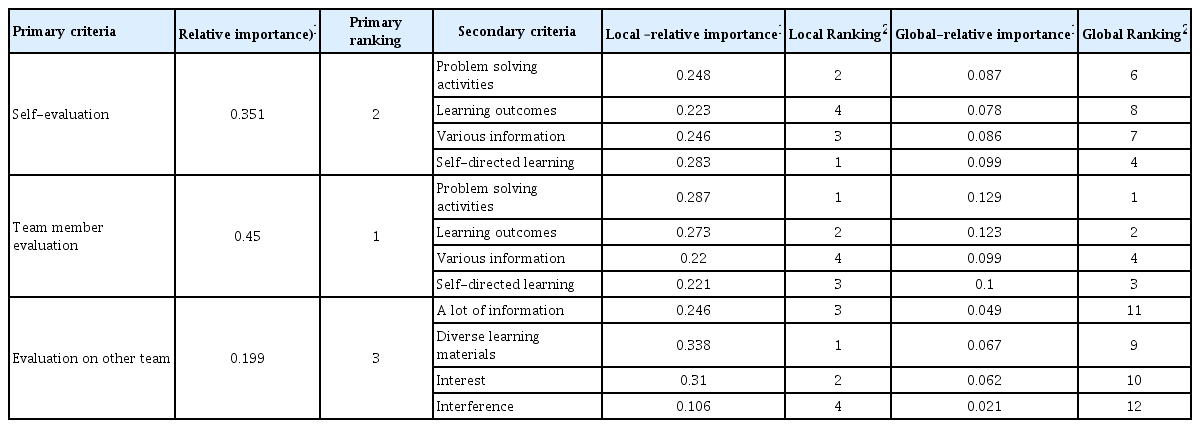
Relative importance and priority for each criterion
Table 2 shows that the most important factor was the team member evaluation (0.450). Followed by self-evaluation (0.351) and evaluation on other team (0.199). As a result, participants in the BPL class were more weighted in the evaluation of the members of the team. On the other hand, this study has a low weighting on the evaluation on other team, which is judged as a possibility that the opportunity to evaluate the team is small.
Within the evaluation of the team members in the secondary criterion, they were interested in problem solving activities (0.287), and self-directed learing (0.283) were highly weighted. However, it is necessary to pay attention to the fact that there are few differences among the four secondary criteria. In addition, it was shown that the interference (0.106) scale is a meaningless evaluation factor in the evaluation of the team, so it is meaningful to exclude it when applying PBL in the future.
Finally, in the relative importance (global weight) of all the measures (twelve items) in the secondary criterion, the problem solving activities (0.129), learning outcomes (0.273), and self-directed learning (0.221) were the most important activity in order.
The above results in Figure 1 shows the relative priority (weights) of all the factore (scales) in a graph.
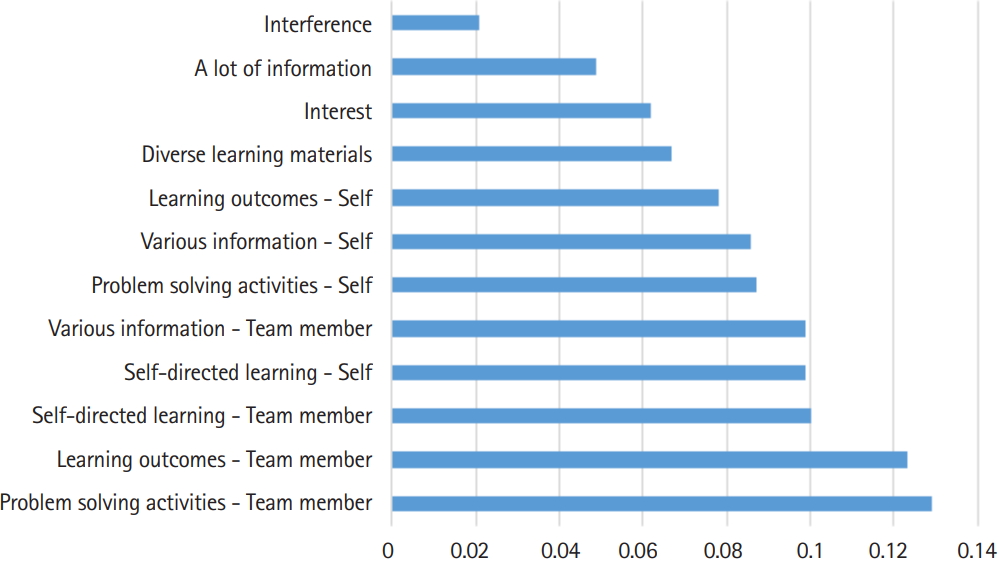
Relative priority by all rating scales.
CONCLUSIONS
This study analyzed the cases using PBL for participants of class in Jeju National University, South Korea. In this study, PBL teaching method is used to determine self - directed learning and problem solving ability. The purpose of this study is to improve the objectivity of the evaluation by applying the AHP methodology to the learner in setting the importance of the PBL evaluation scale. The results of this analysis can be summarized as follows.
Firstly, the evaluation scale is a very important satisfaction factor while learning using the PBL learning method. However, most evaluation scales are simply measured on a 5-point scale, making it difficult to meet the individual needs of each learner. However, as in this study, the AHP methodology through learner 's agreement will be an incentive to increase the satisfaction level of the PBL learning method.
Secondly, PBL evaluation scale factors In the first criterion, team member evaluation (0.450) was the most important factor. As a result, participants in the PBL class were more weighted in the evaluation of the members in the team. Within the evaluation on the team members in the second criterion, they were interested in problem solving activities (0.287), and self-directed learning (0.283) were highly weighted. Finally, in the relative importance (global weight) of all the measures (12 items) in the secondary criterion, the problem solving activities (0.129), learning outcomes (0.273), and self-directed learning (0.221) were the most important activity in order. Although it is limited to this case, applying this methodology will allow instructors to reflect on their lecture plan when using other PBL lessons.
Thirdly, if additional items are inserted by the 5 point Likert scale between the whole evaluation items in the questionnaire item and regression analysis is used as the basis for applying the IPA (Importance-Performance Analysis) method on the total satisfaction scale . In other words, additional implications can be calculated by applying an IPM (Importance-Performance Analysis) based on Partial Least Square-Structural Equation Method (PLS_SEM) (Hair et al., 2016).
In conclusion, this educational design based on creativity has the advantages of PBL in that the students become more involved in class by engaging themselves creatively and actively, and the university can naturally contribute to nurturing creative talents. In particular, as in this study, by setting the weight of the PBL evaluation scale among the learners themselves, the satisfaction of the learning effect can be increased.
Acknowledgements
This paper was supported by funding (2018) from the Halla Newcastle PBL Education and Research Center. The author sincerely appreciate anonymous reviewers for the guidance in preparing this paper for publication.